Daily Request Report
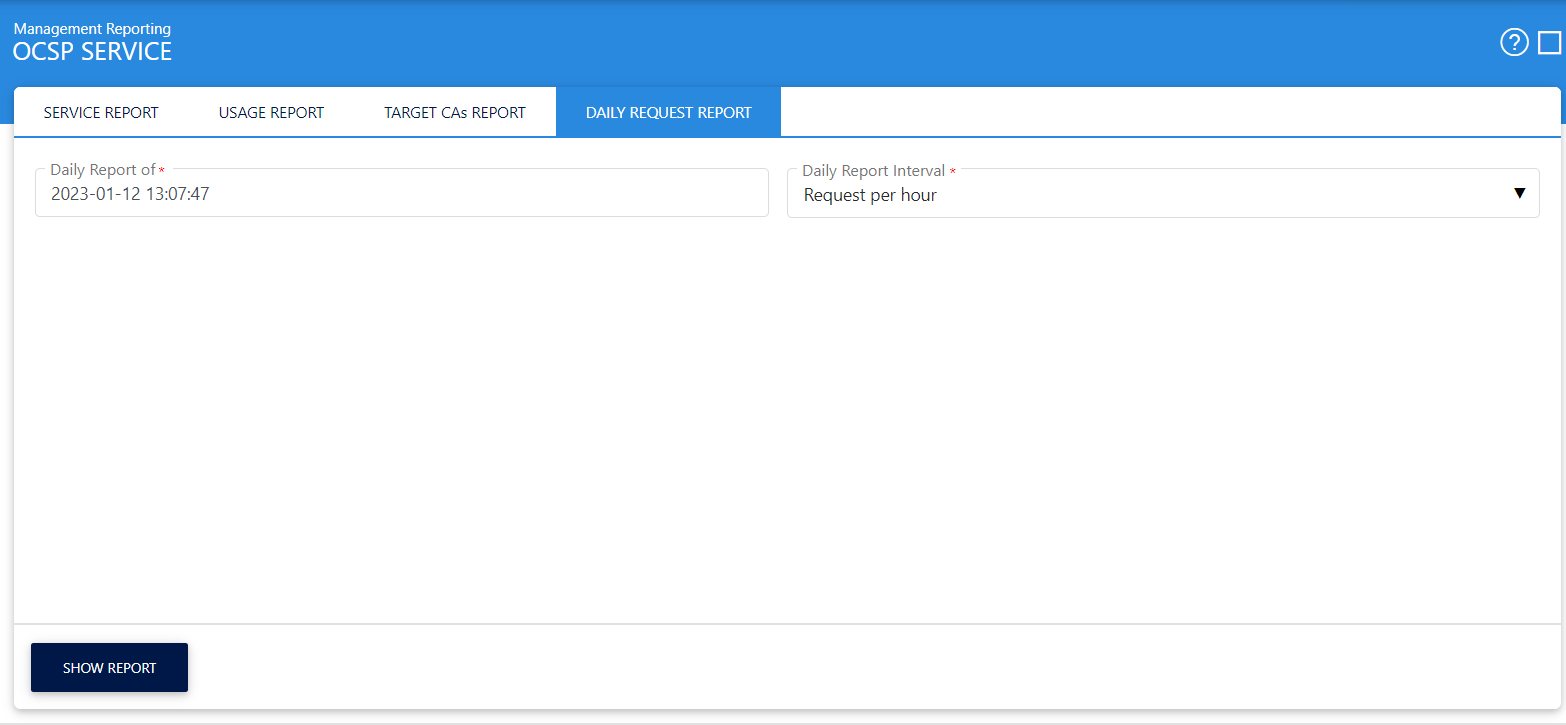
This report allows you to view the requests received in a day. The Line Graph shows the daily OCSP Service transactions per hour or per 15 minutes. Simply select "Show report per hour" or "Show report per 15 minutes" and press the Show Report button:
Clicking on 'Show Report' button displays the following screen:
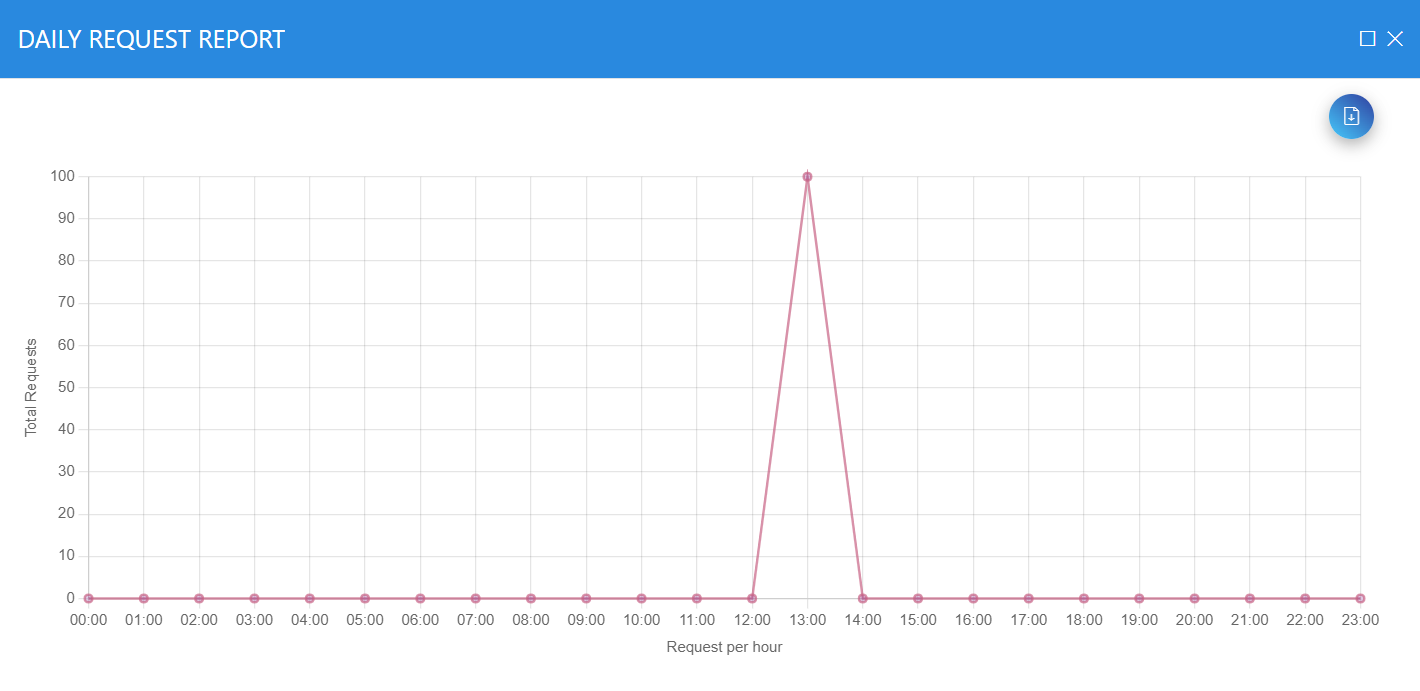
This report can be exported as a zipped CSV format file.
See also
Usage Report
Target CA Report
Daily Request Report
Service Statistical Report