Transactions Log Viewer
The OCSP Monitor transaction log records every request and response message:

Each item in the screenshot is described below (use Customise Columns to show all options):
|
Items |
Description |
|
Log ID |
A unique system defined serial number for the log record. |
|
Scenario Name |
A user defined name for the test scenario. |
|
Test Case Name |
A user defined name for the test case. |
|
Result |
This shows the status for the response i.e. PASSED or FAILED. |
|
Cert Alias |
Shows the Distinguished Name. |
|
Request Time |
Records the date/time when the request was received. |
|
Response Time |
Records the date/time when the response was sent. |
|
Request/Response |
Shows a hyperlink to view the request/response messages in a new window. See below for further details. |
|
Expected Response |
Shows the response which has been set in test case expected result. |
|
Received Response |
Shows the actual response received. |
|
Error Code |
Bring mouse over the View link to see the error code if the transaction is failed for some reason. |
|
Clear Search |
After a Search this window will only show the filtered records. The Clear Search button is used to view the full set of records. |
|
Search |
This opens a new window where search criteria can be entered based on each column of the transaction grid. See below for further details. |
|
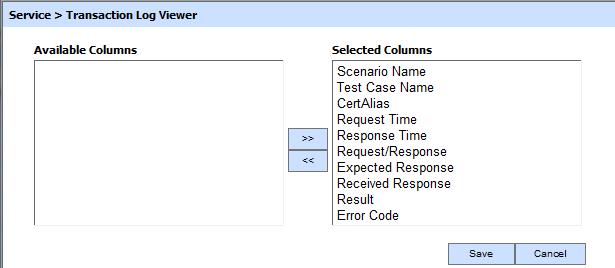
Customise Columns |
This opens a new window to configure which column need to be shown on the grid and which column need to be hidden. See below for details. |
|
|< < > >| |
These buttons are for navigating the different pages of the transaction log. Note the number of records shown per page is configurable from within Global Settings. |
|
Export Logs |
Used to export the logs shown in Transactions Log Viewer window into a tab separated file at a configurable path. Note the records continue to remain in the database also (i.e. they are not deleted from the database as part of the export process). |
|
Verify Integrity |
Verifies the integrity of the service transaction log records. It detects tampered and deleted records and generates a report that can be exported to a physical drive. When exporting the HMAC verification report, it is recommended to save the file with “.html” extension so that the report can be viewed in an internet browser. |
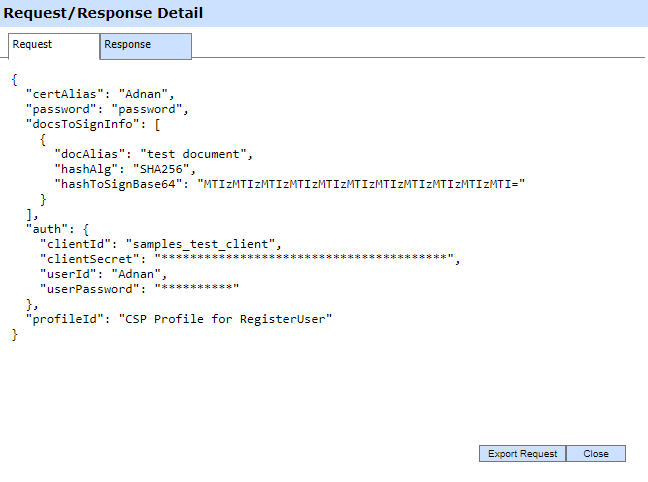
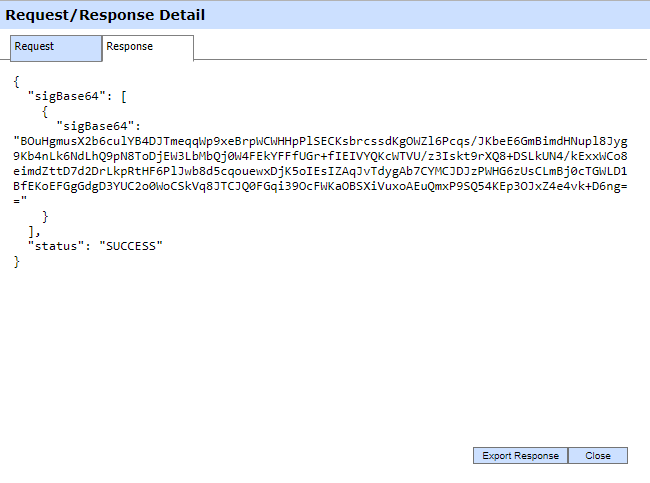
Clicking on the View link for Request/Response displays the request and response sent or received during this transaction as shown below.
Customising the Display
The Customise Columns button shows the following screen where you can select the data items to be shown:
Viewing Archived Logs
To view data within archived logs, choose "Show Archived" instead of "Current" and click the GO button. A prompt is shown to select the relevant archived log file:
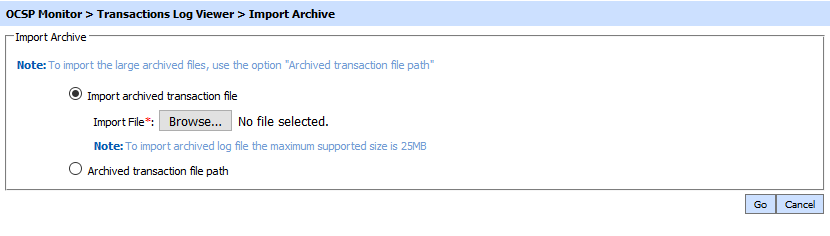
Note that archived transaction records are only temporarily imported into the OCSP Monitor database and then removed when you stop viewing the records.
Verifying Data Integrity
Each log record within the database is protected using an HMAC checksum to detect any intentional or accidental modification of records. Clicking the Verify Integrity button checks the log integrity and generates a report as shown below:
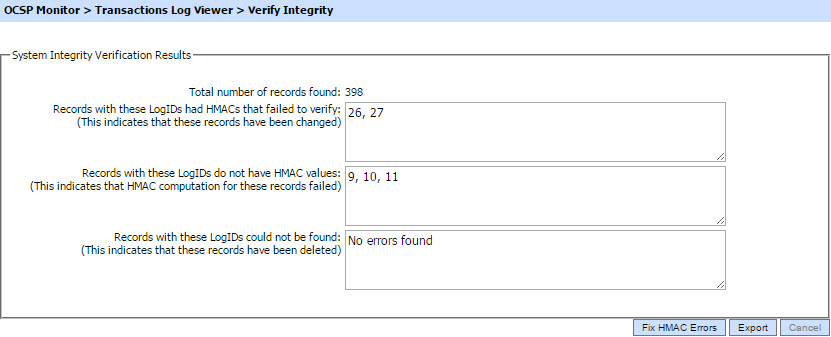
Click on the Export logs button to export the request/response to a network file. Clicking the Fix HMAC Errors button will re-calculate the HMAC for tempered transaction logs records for this module.
Note that this option will not detect the unauthorized deleted records but it will only fix the unauthorized modifications and/or ambiguous records for which HMAC value is not present/incorrect.
|
|
Verify Integrity feature is available for the transactions log of all services within ADSS Server. |

Searching Transaction Data
The Search button displays following screen:

If a search is based on multiple values, then these will be combined together using the “AND” operator, and thus only records that meet all the criteria will be presented.
See also
Test Cases
Test Scenarios
Live Report
Logs Archiving
Alerts
Management Reporting