View signature charts
SigningHub enables you to view the graphical representation of signatures related stats of your enterprise. This includes pie charts, bar chart and timeline of signature activities. Use them to monitor the overall system usage from different aspects to control your billing.
View signature charts of your enterprise
- Login with your enterprise admin credentials.
- Click your profile drop down menu (available at the top right corner).
- Click the "Enterprise Settings" option.
- Click the "Reports" option from the left menu.
- Click the "Signature Charts" tab.
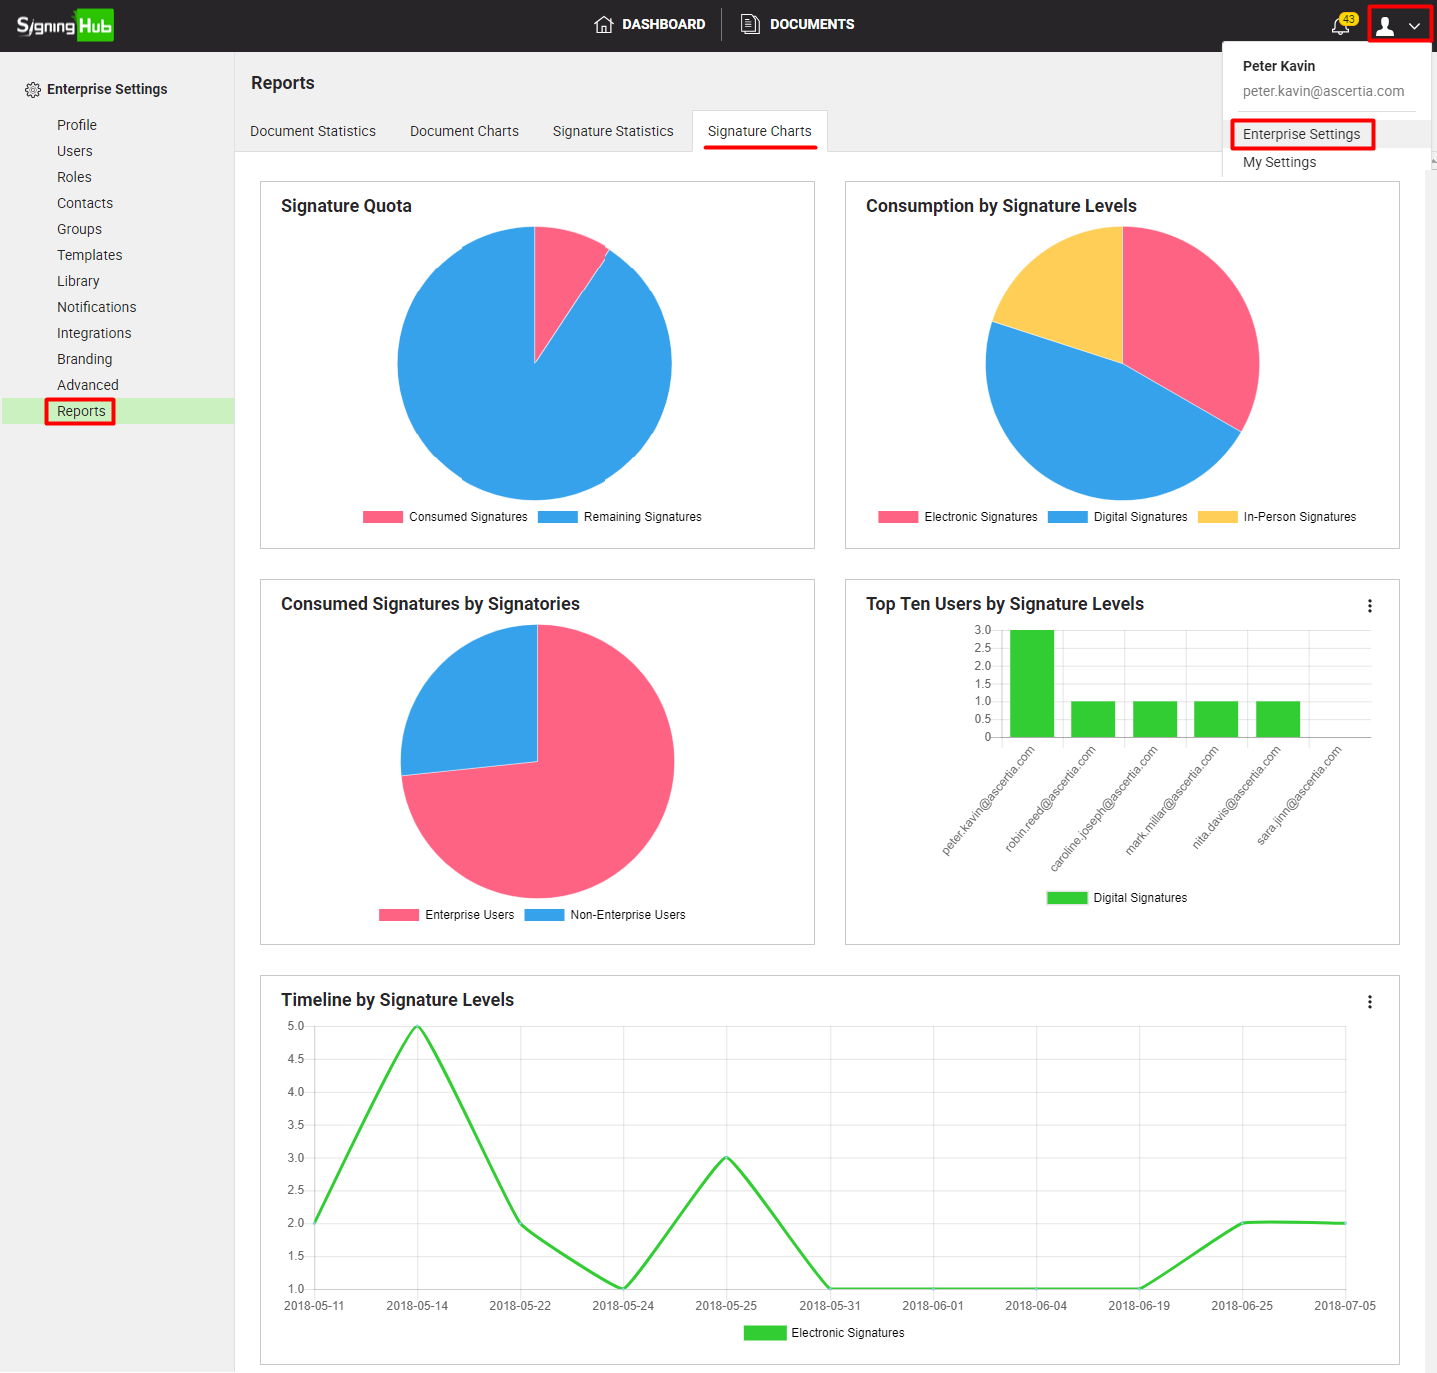
Signature Quota
This pie chart delineates the number of consumed and remaining signatures out of the allotted signature quota of your enterprise account.
Consumption by Signature Levels
This pie chart delineates the number of electronic signatures, digital signatures and in-person signatures applied out of the consumed signatures quota of your enterprise account.
Consumed Signatures by Signatories
This pie chart delineates the number of your enterprise users and non enterprise users (i.e. Guest users and External users) who consumed the signature quota of your enterprise account.
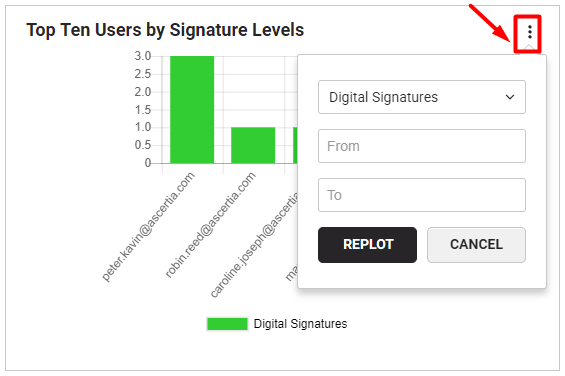
Top Ten Users by Signature Levels
This bar chart lets you select a signature level from the given list and specify the date parameters to see its top ten performers from your enterprise users, i.e. Top ten users who have:
- Applied the highest number of digital signatures in a specified time period
- Applied the highest number of electronic signatures in a specified time period
- Applied the highest number of in-person signatures in a specified time period
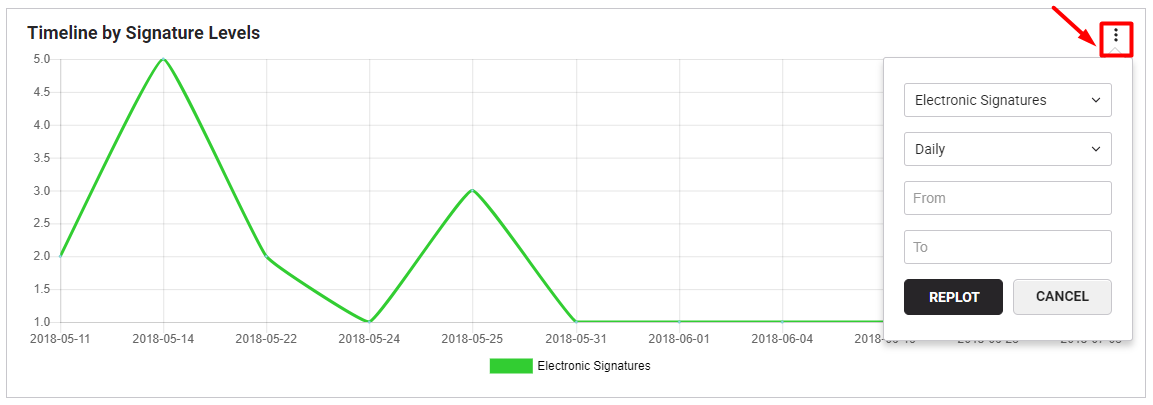
Timeline by Signature Levels
This timeline lets you choose a signature level from the given list, frequency, and the date parameters to view their respective graph, i.e.
- Total number of electronic signatures applied on daily basis within a specified time period by all your enterprise users
- Total number of digital signatures applied on weekly basis within a specified time period by all your enterprise users
- Total number of in-person signatures applied on weekly basis within a specified time period by all your enterprise users, and so on.