System Reports
SigningHub provides certain real-time statistical reports related to Service plans, Accounts, and Billings that could facilitate the stakeholders in taking the appropriate business decisions. The access of "Reports" option can be controlled from the "Access Control" area, so its accessibility can be restricted to the concerned operators/ officials.
View the system reports
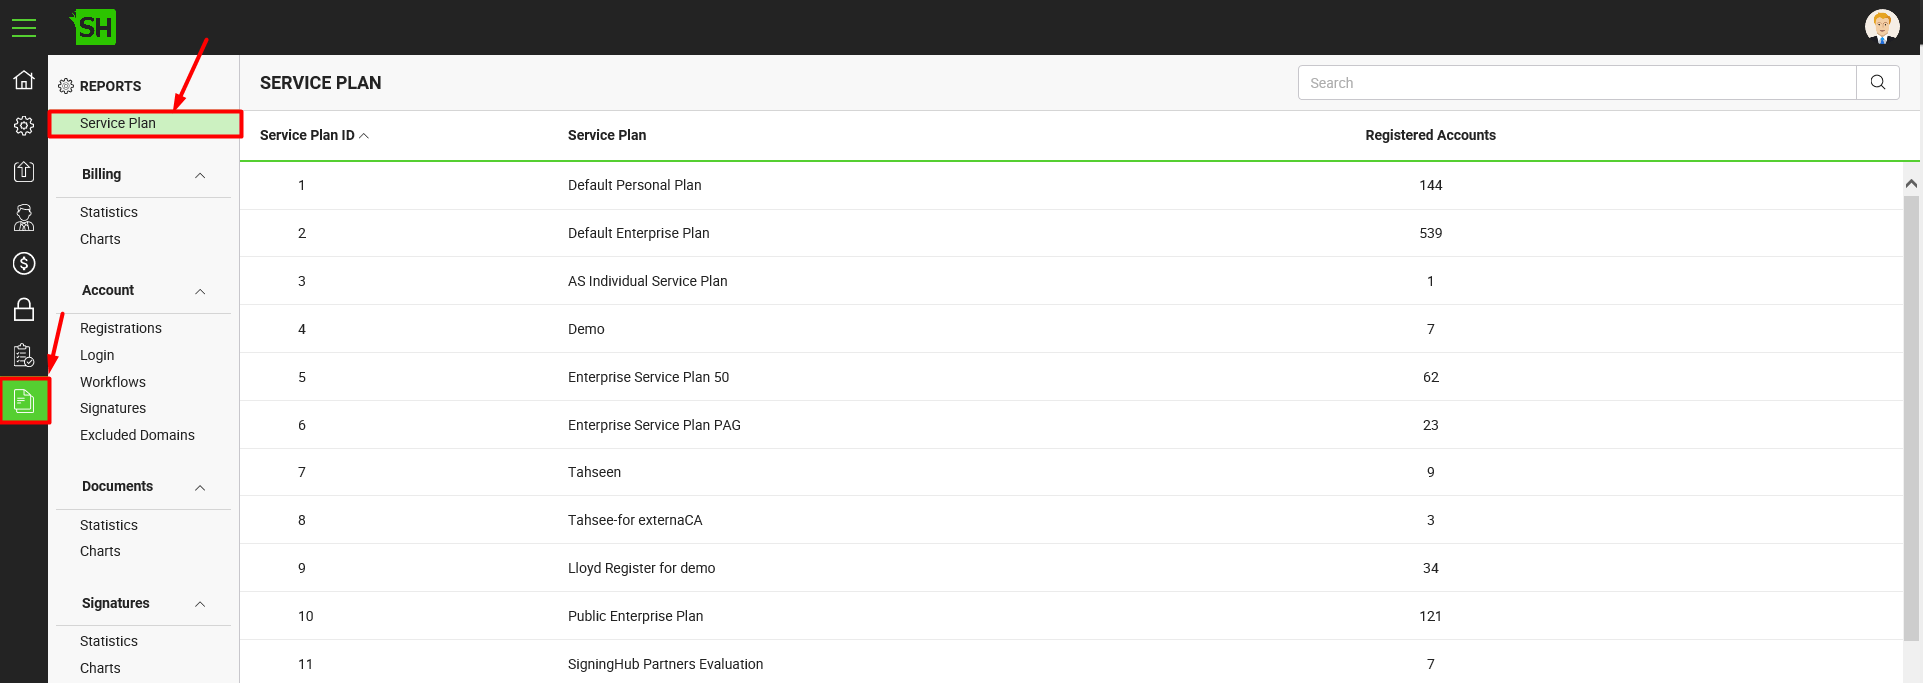
- Click the "Reports" option from the left menu.
- Click the desired report from the "Reports" panel.
The respective stats will be displayed accordingly.
Currently, the following reports are being offered. The retrieved stats from these reports can be exported to excel files as required.
- Service Plan:
This report gives the stats about total number of registered accounts against each service plan inside your deployment.
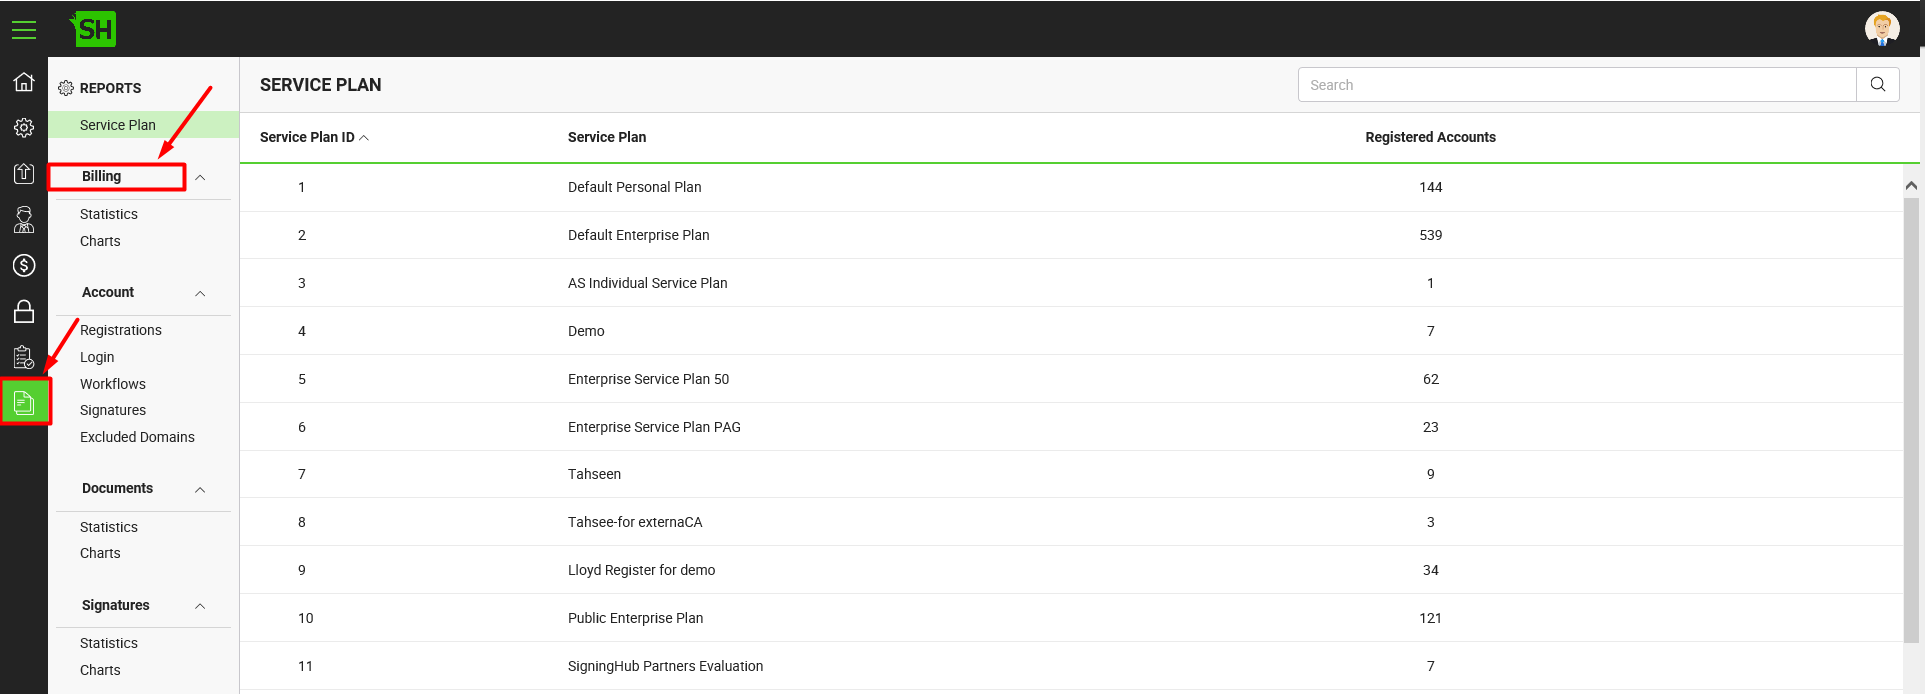
- Billing:
This report gives the billing insight of each month against your deployment. It is comprised of number of new payments, new revenue received (in terms of the default currency), number of recurring payments, recurring revenue received (in terms of the default currency), total VAT, total number of new and recurring payments, and aggregated amount of new and recurring revenue received.
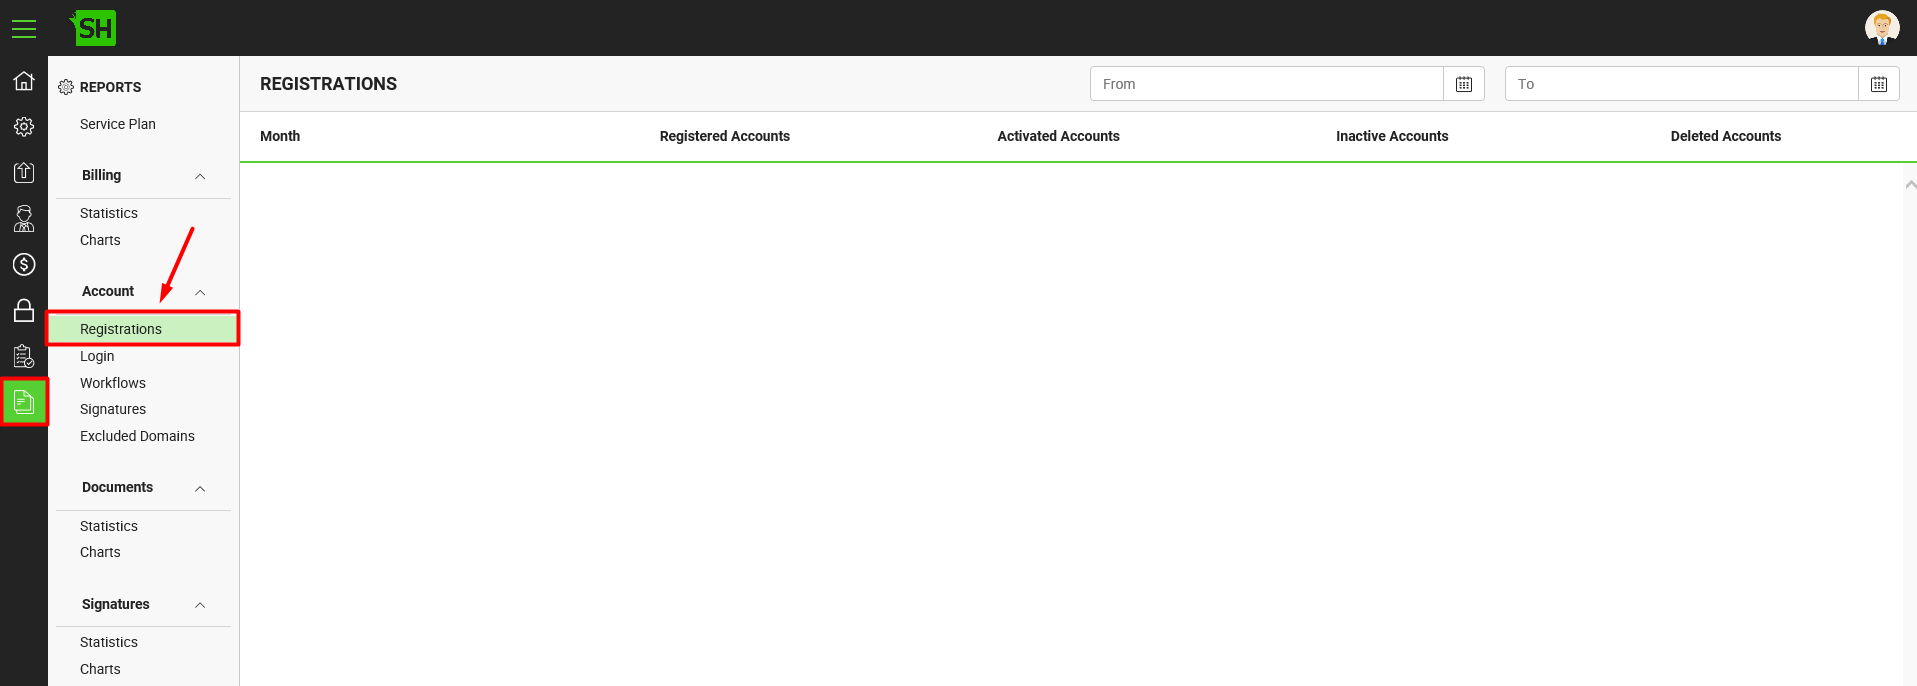
- Account - Registrations:
This report gives the registrations related stats of each month against your deployment. It is comprised of total number of accounts that are registered, activated, inactivated and deleted. You can also search these records on the basis of "from" and "to" dates.
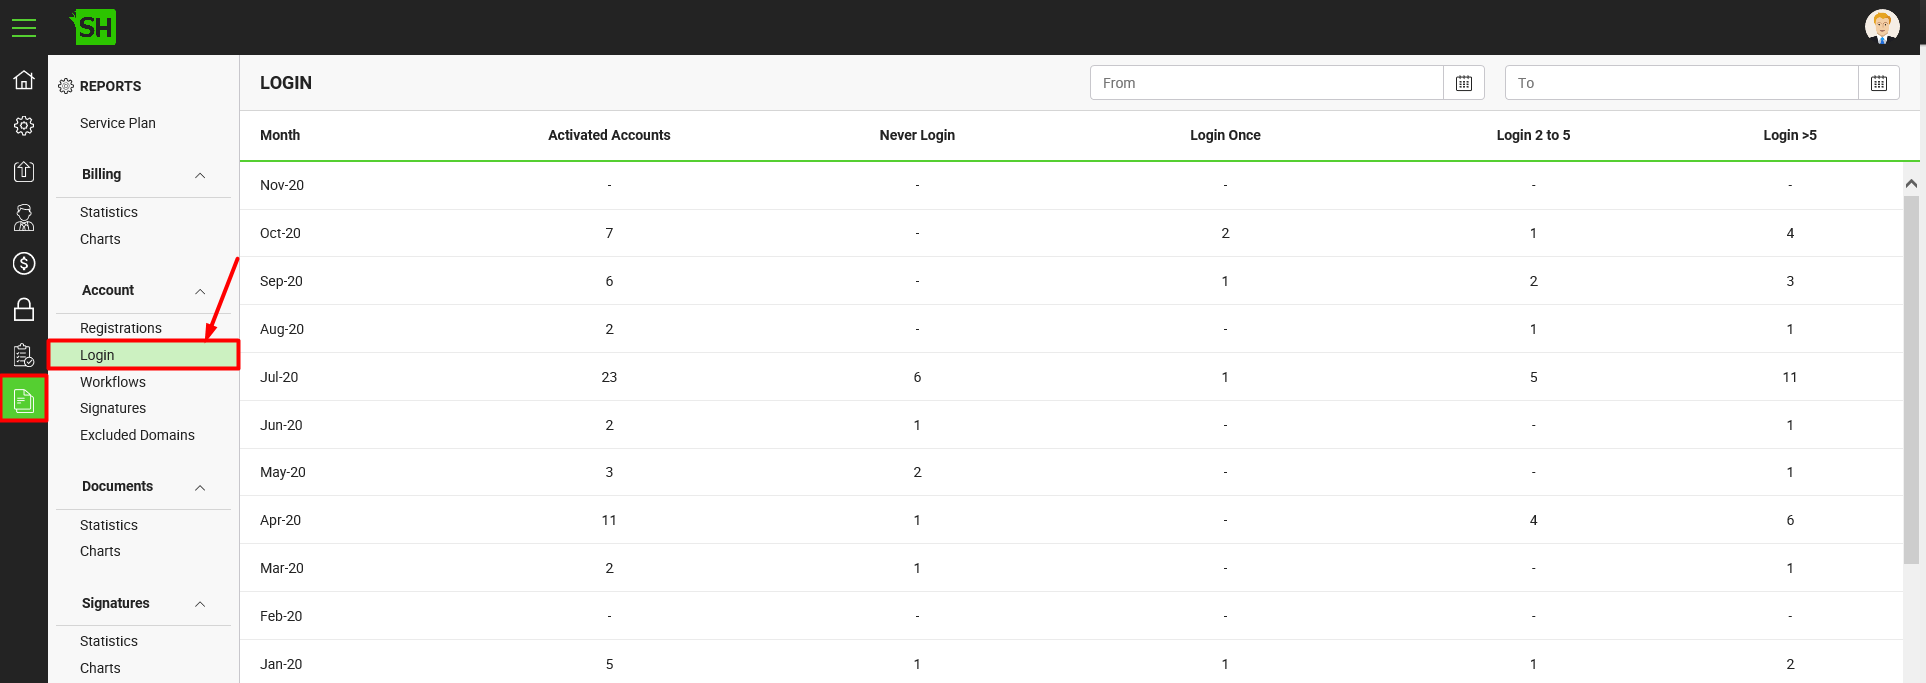
- Account - Login:
This report gives the login related stats of each month against your deployment. It is comprised of number of users who activated their accounts, never logged in, logged in only once, logged in 2 to 5 times, and who logged in more than 5 times. You can also search these records on the basis of "from" and "to" dates.
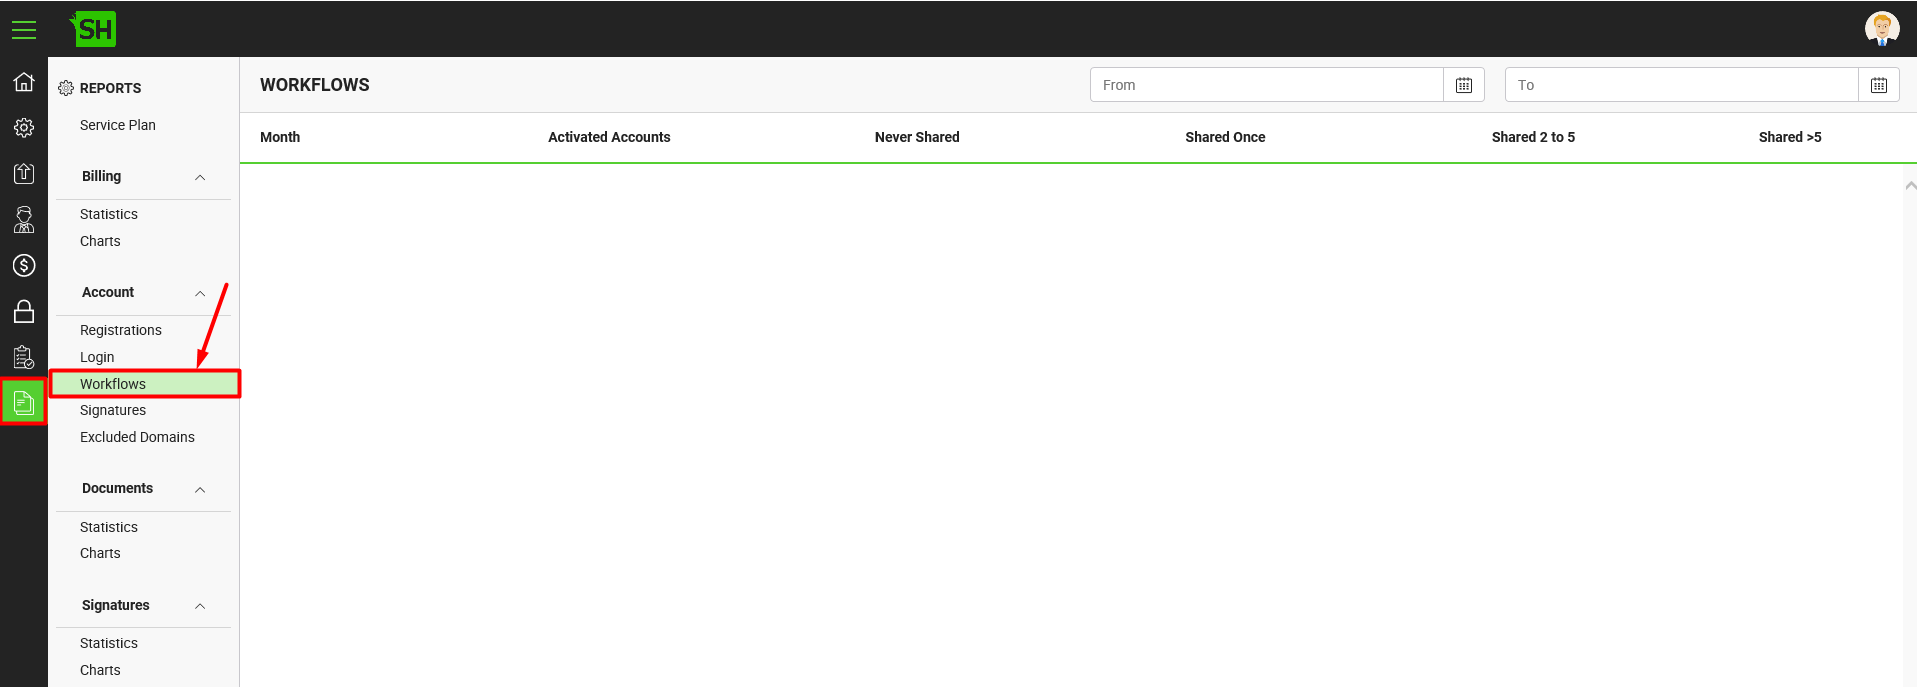
- Account - Workflows:
This report gives the workflows related stats of each month against your deployment. It is comprised of number of users who activated their accounts, never shared any document, shared only once, shared 2 to 5 times, and who shared the documents more than 5 times. You can also search these records on the basis of "from" and "to" dates.
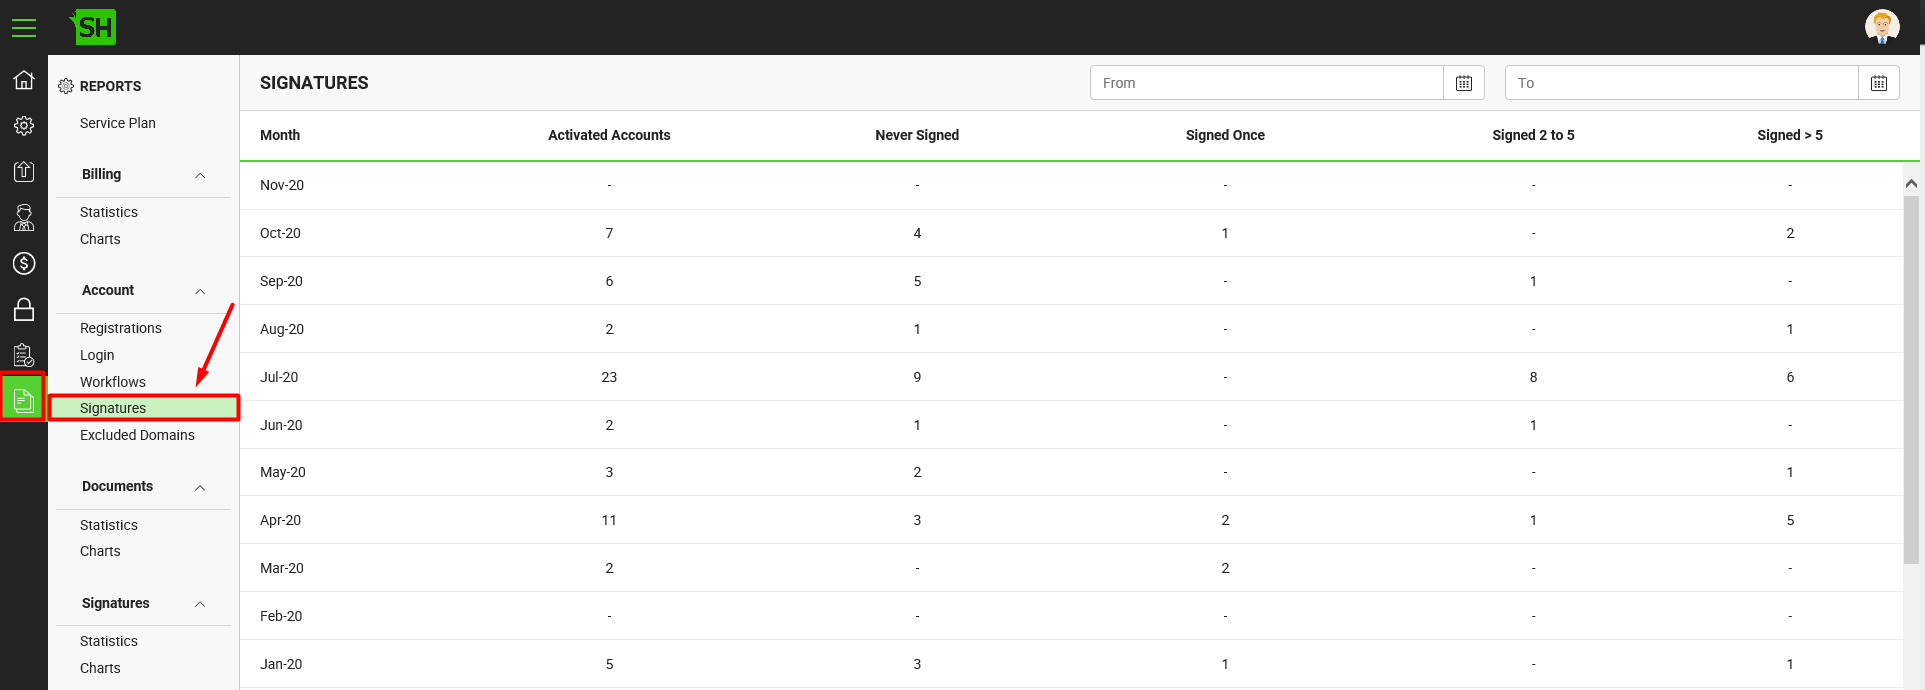
- Account - Signatures:
This report gives the signatures related stats of each month against your deployment. It is comprised of number of users who activated their accounts, never signed any document, signed only once, signed 2 to 5 times, and who signed the documents more than 5 times. You can also search these records on the basis of "from" and "to" dates.
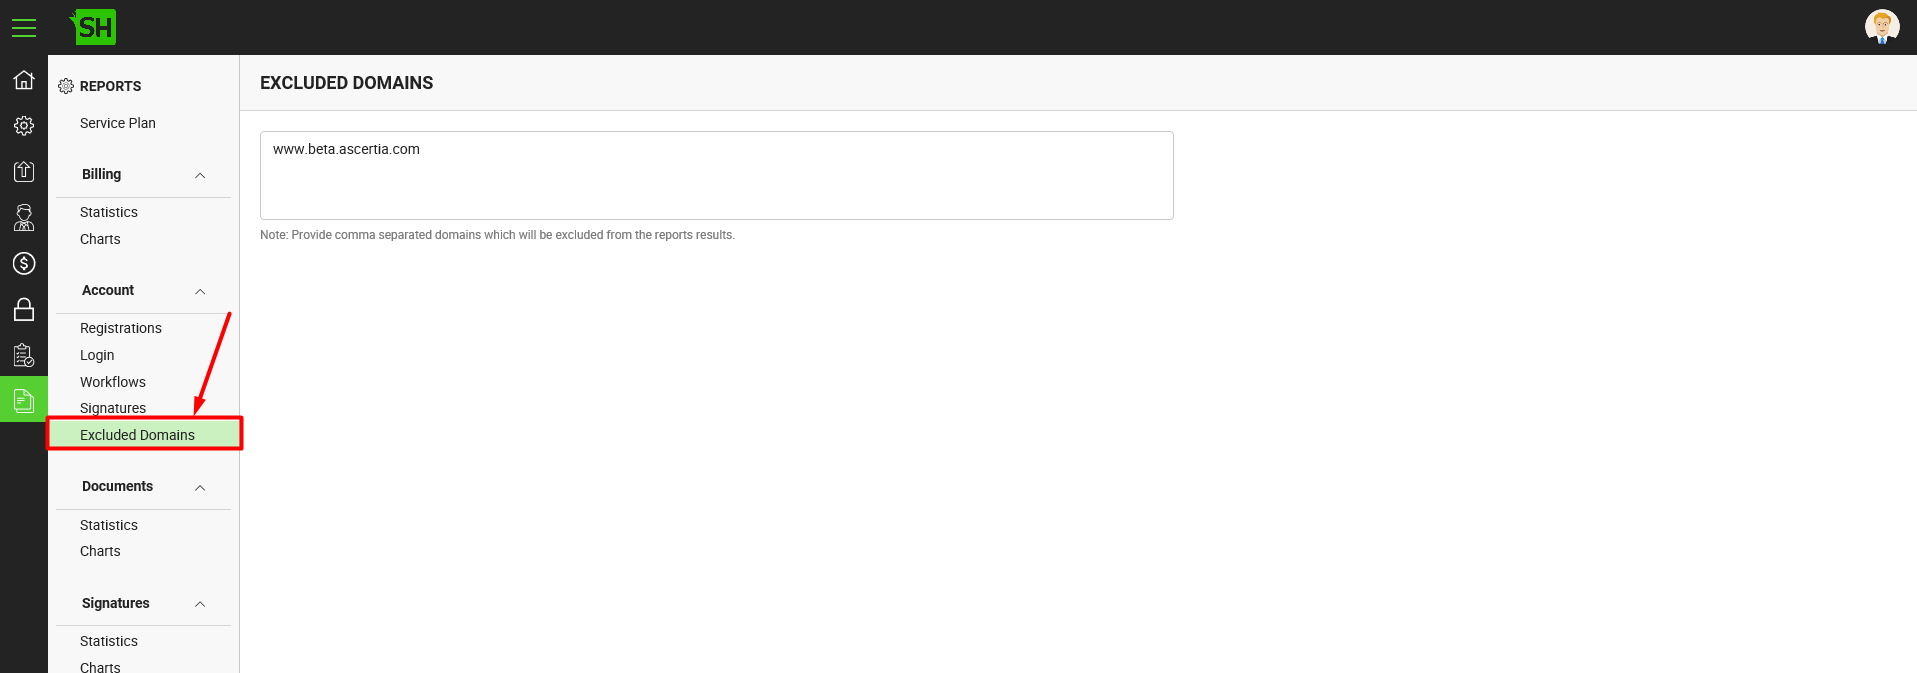
- Account - Excluded Domains:
Use this field to specify those domains that you want to exclude from the reports stats and click the "Save" button from the screen bottom. You can use comma to add multiple domains. If you leave it blank, SigningHub will show the stats of all the domains in reports.
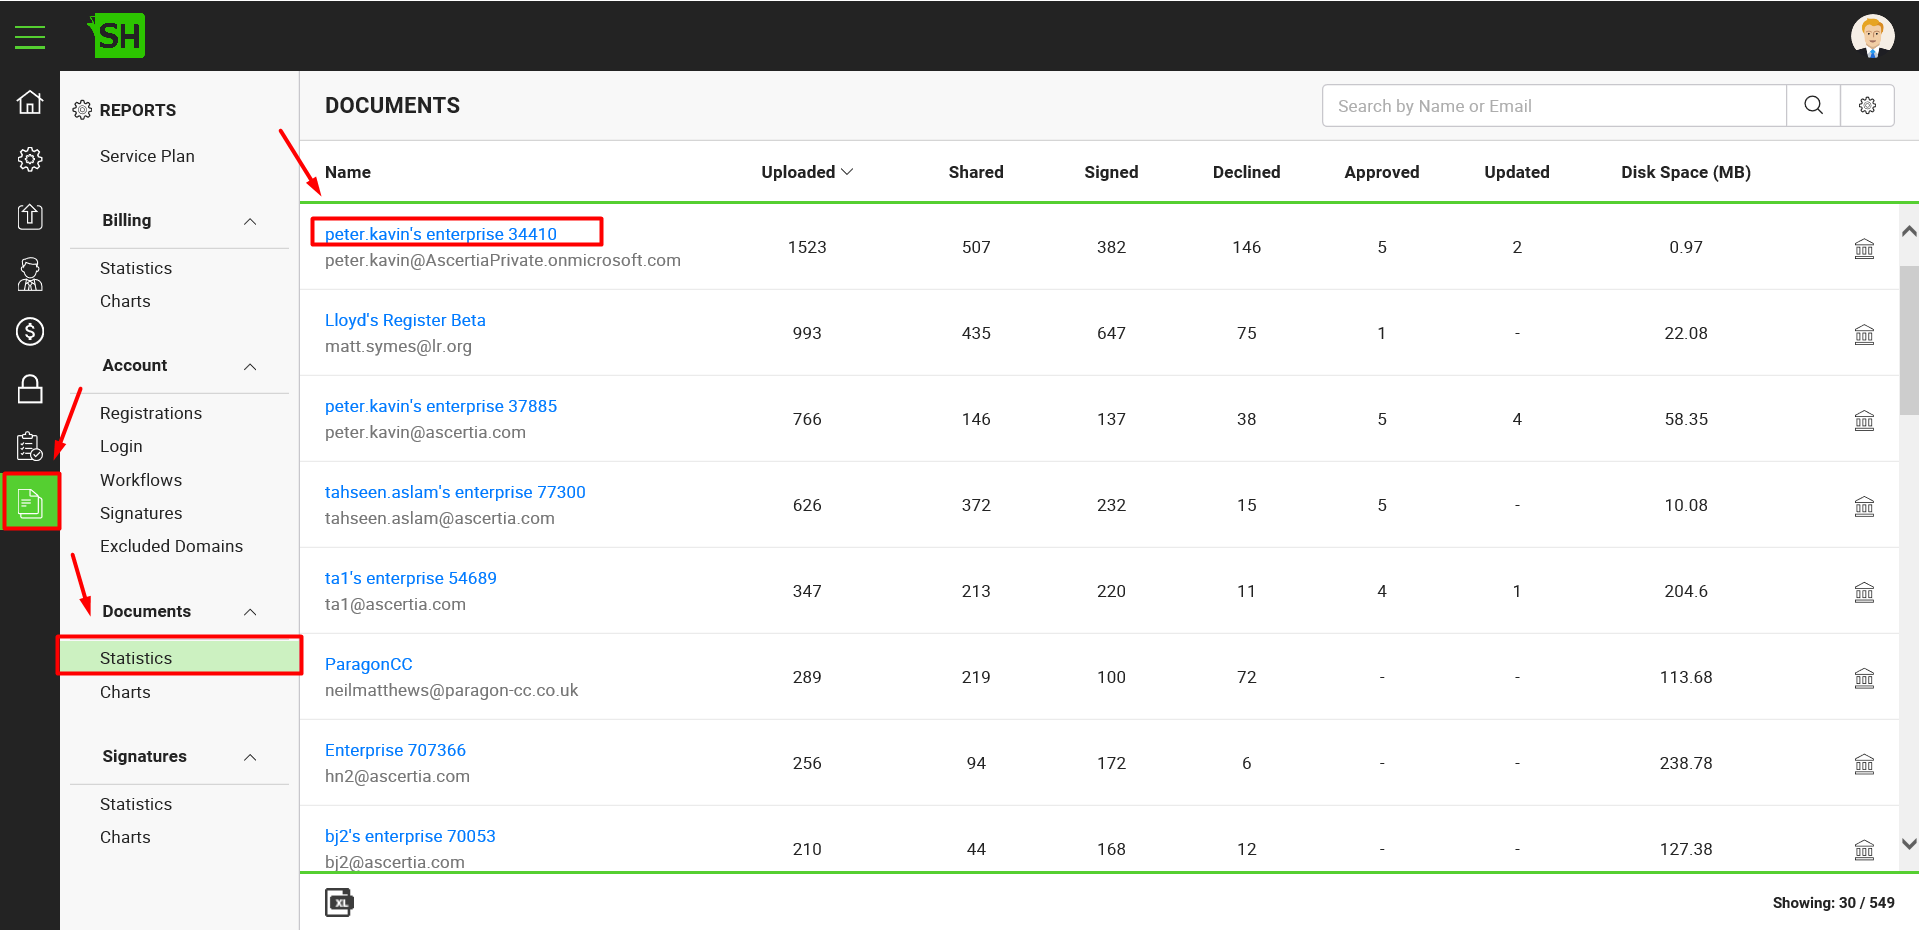
- Documents - Statistics:
This report gives the documents related stats for each individual/ enterprise account against your deployment. It entails information regarding total number of documents that have been uploaded, shared, signed, declined, approved, and updated by each account and also the disk space they are consuming. It also allows viewing the inside details at user level against each enterprise account.
You can search these records on the basis of account name or email, and can also sort them in ascending or descending order by clicking the respective column header.
Click an enterprise account from the grid to view its user level details. It provides the user based counts of uploaded, shared, signed, approved, updated, and declined documents along with their consumed disk space.
You can search these records on the basis of "from" and "to" dates or user name/ email, sort them in ascending or descending order as required, and can also download them in excel sheet. - Documents - Charts:
This option provides the graphical representation of documents related stats of your deployment. This includes pie chart, bar chart and timeline of document activities.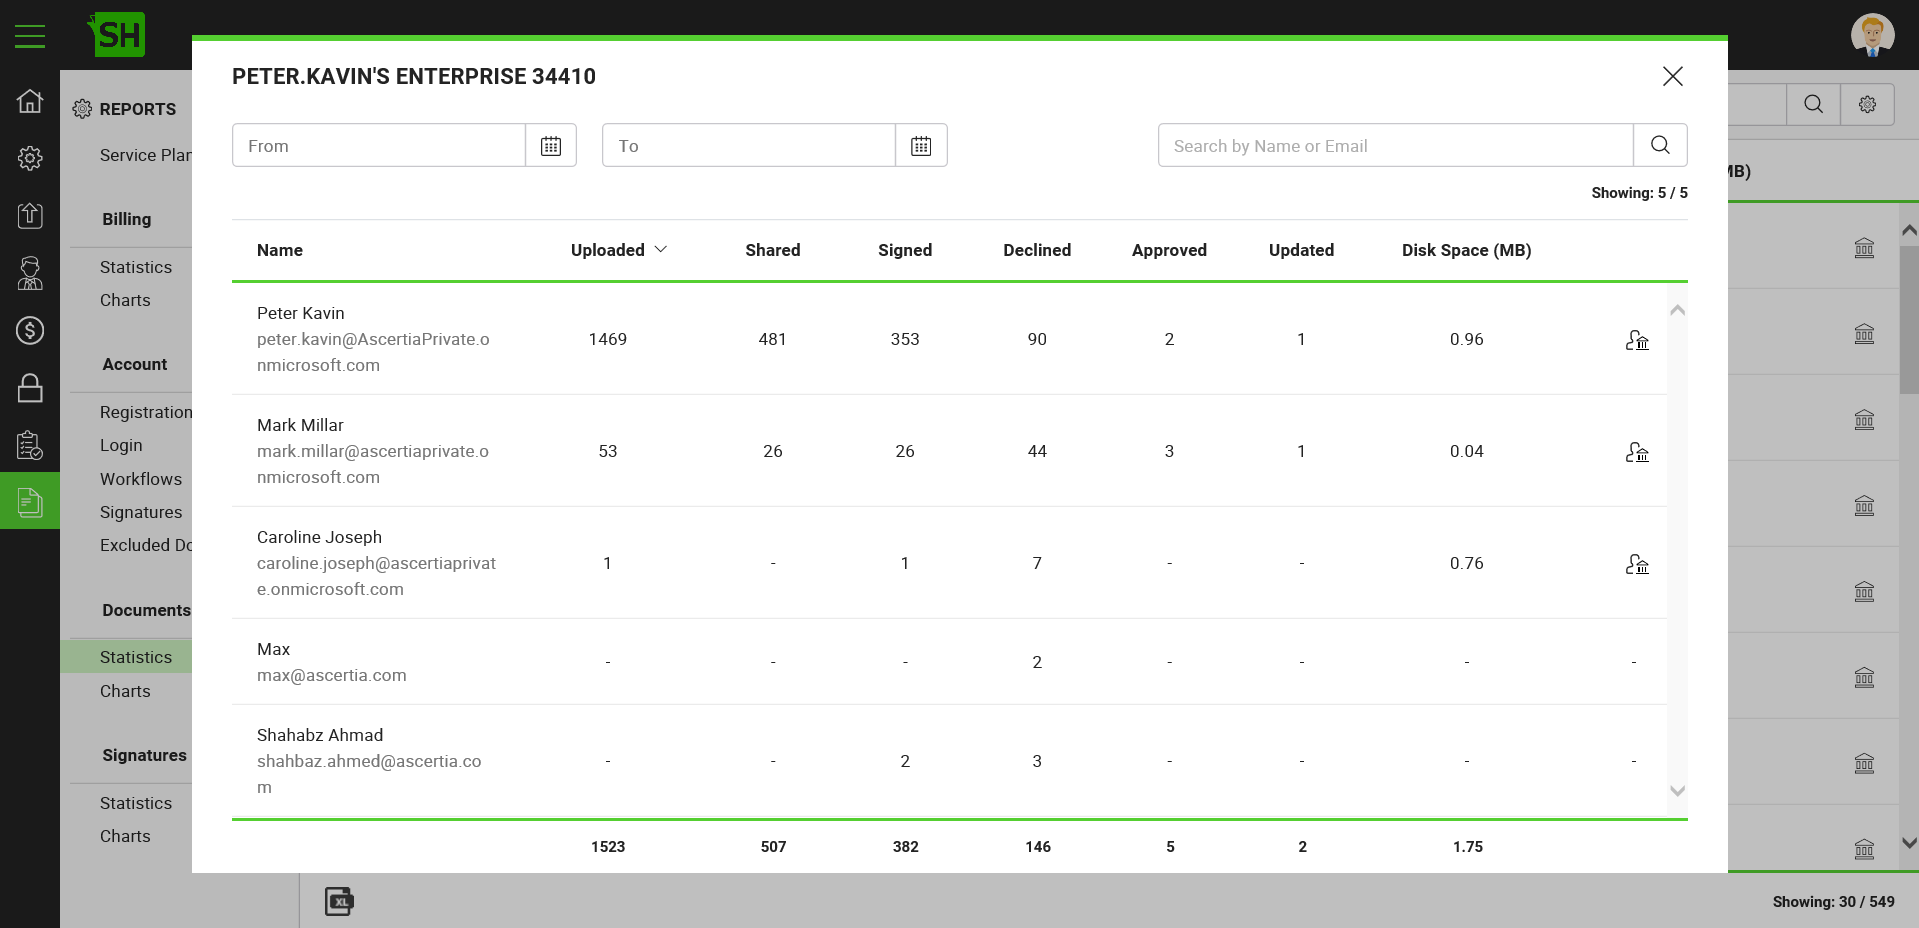
- Documents by Status - This pie chart delineates the status based counts of total documents within your deployment, i.e. Draft, In Progress, Pending, Signed, Approved, Updated, Declined, and Completed documents.
- Top Ten Accounts by Document Activity - This bar chart lets you choose a document activity (i.e. Shared, Uploaded, Signed, etc.) from the given list and specify the date parameters to see its top ten performers from your deployment. Click the
 menu from top right corner of the bar chart to specify your preferences, i.e. Top ten users who have:
 - Shared the highest number of documents in a specified time period
- Uploaded the highest number of documents in a specified time period
- Signed the highest number of documents in a specified time period
- Declined the highest number of documents in a specified time period
- Approved the highest number of documents in a specified time period
- Updated the highest number of documents in a specified time period
- Consumed the most portion of disk space in a specified time period
- Timeline by Document Activity - This timeline lets you choose a document activity (i.e. Shared, Uploaded, Signed, etc.) from the given list, frequency, and the date parameters to view their respective graph. Click the
 menu from top right corner of the timeline to specify your preferences i.e.
 - Total number of documents shared on daily basis within a specified time period by all users
- Total number of documents signed on weekly basis within a specified time period by all users, and so on.
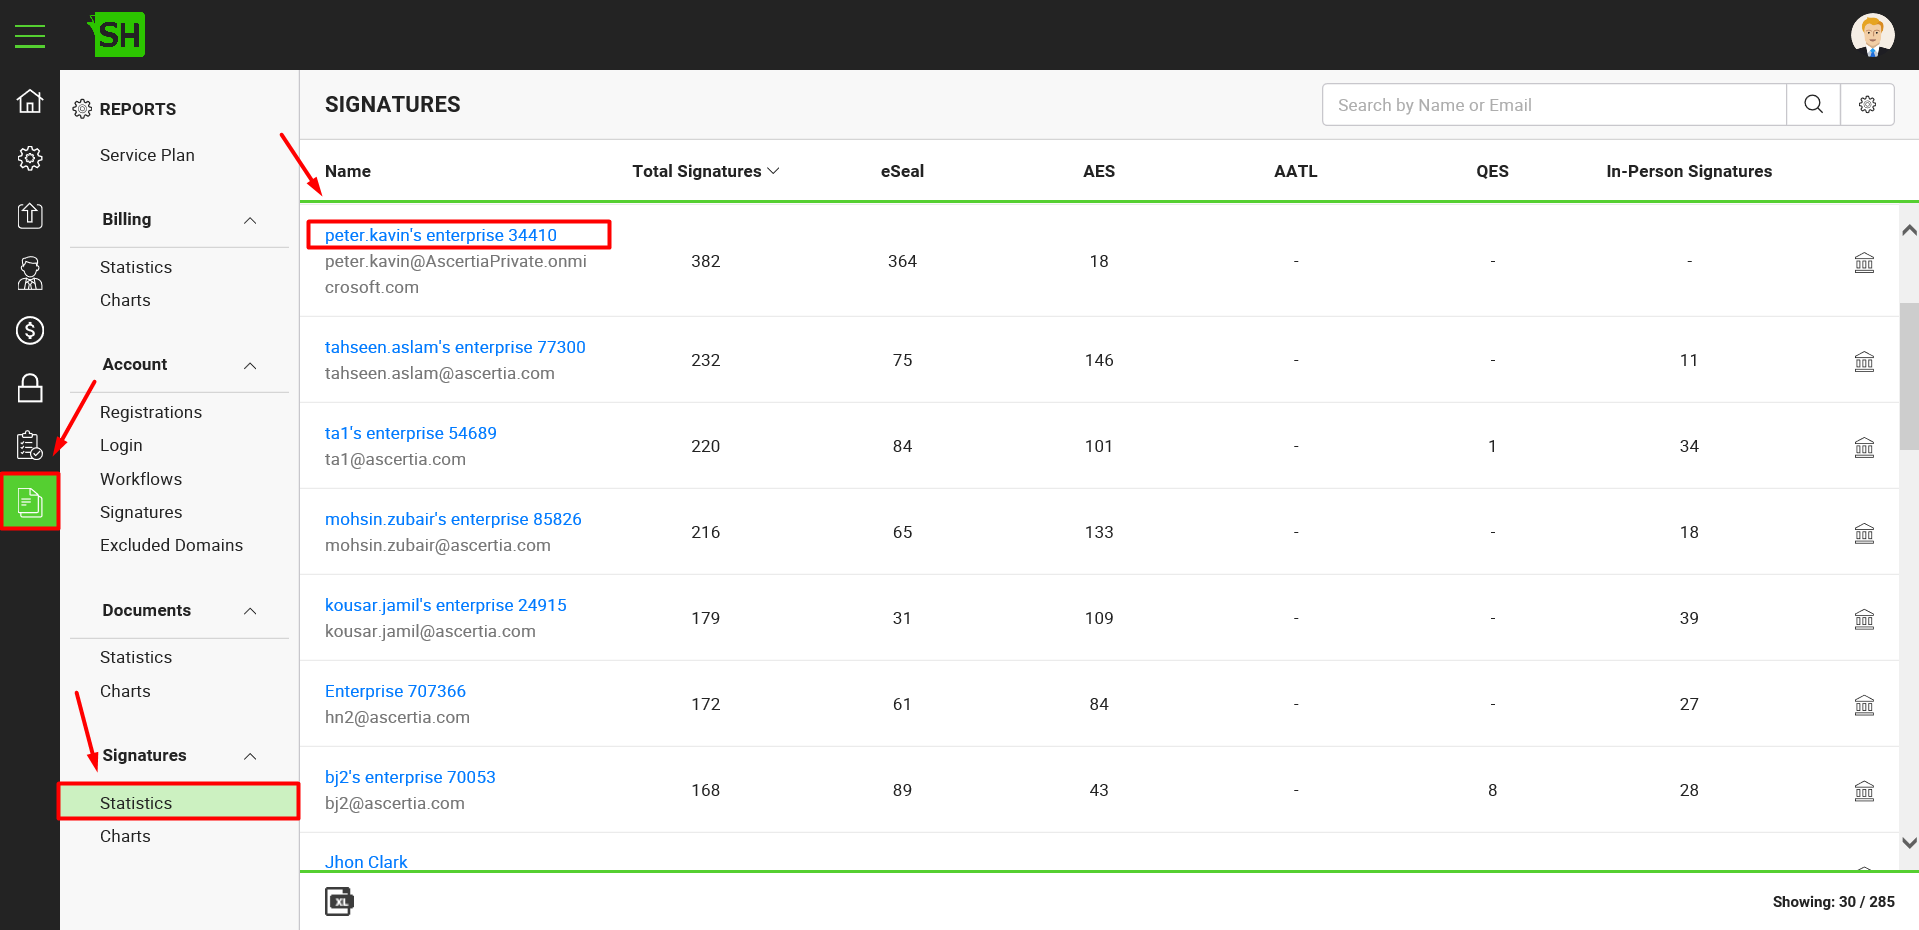
- Signatures - Statistics:
This report gives the signatures related stats for each individual/ enterprise account against your deployment. It entails information regarding total number of signatures that have been consumed by each account along with their respective digital, electronic and in-person signature counts breakup. It also allows viewing the inside details at user level against each enterprise account.
You can search these records on the basis of account name or email, and can also sort them in ascending or descending order by clicking the respective column header.
Click an enterprise account from the grid to view its user level details. It provides the user based counts of consumed Digital, Electronic, and In-person signatures.
You can search these records on the basis of "from" and "to" dates or user name/ email, sort them in ascending or descending order as required, and can also download them in excel sheet. - Signatures - Charts:
This option provides the graphical representation of signatures related stats of your deployment. This includes pie charts, bar chart and timeline of document activities.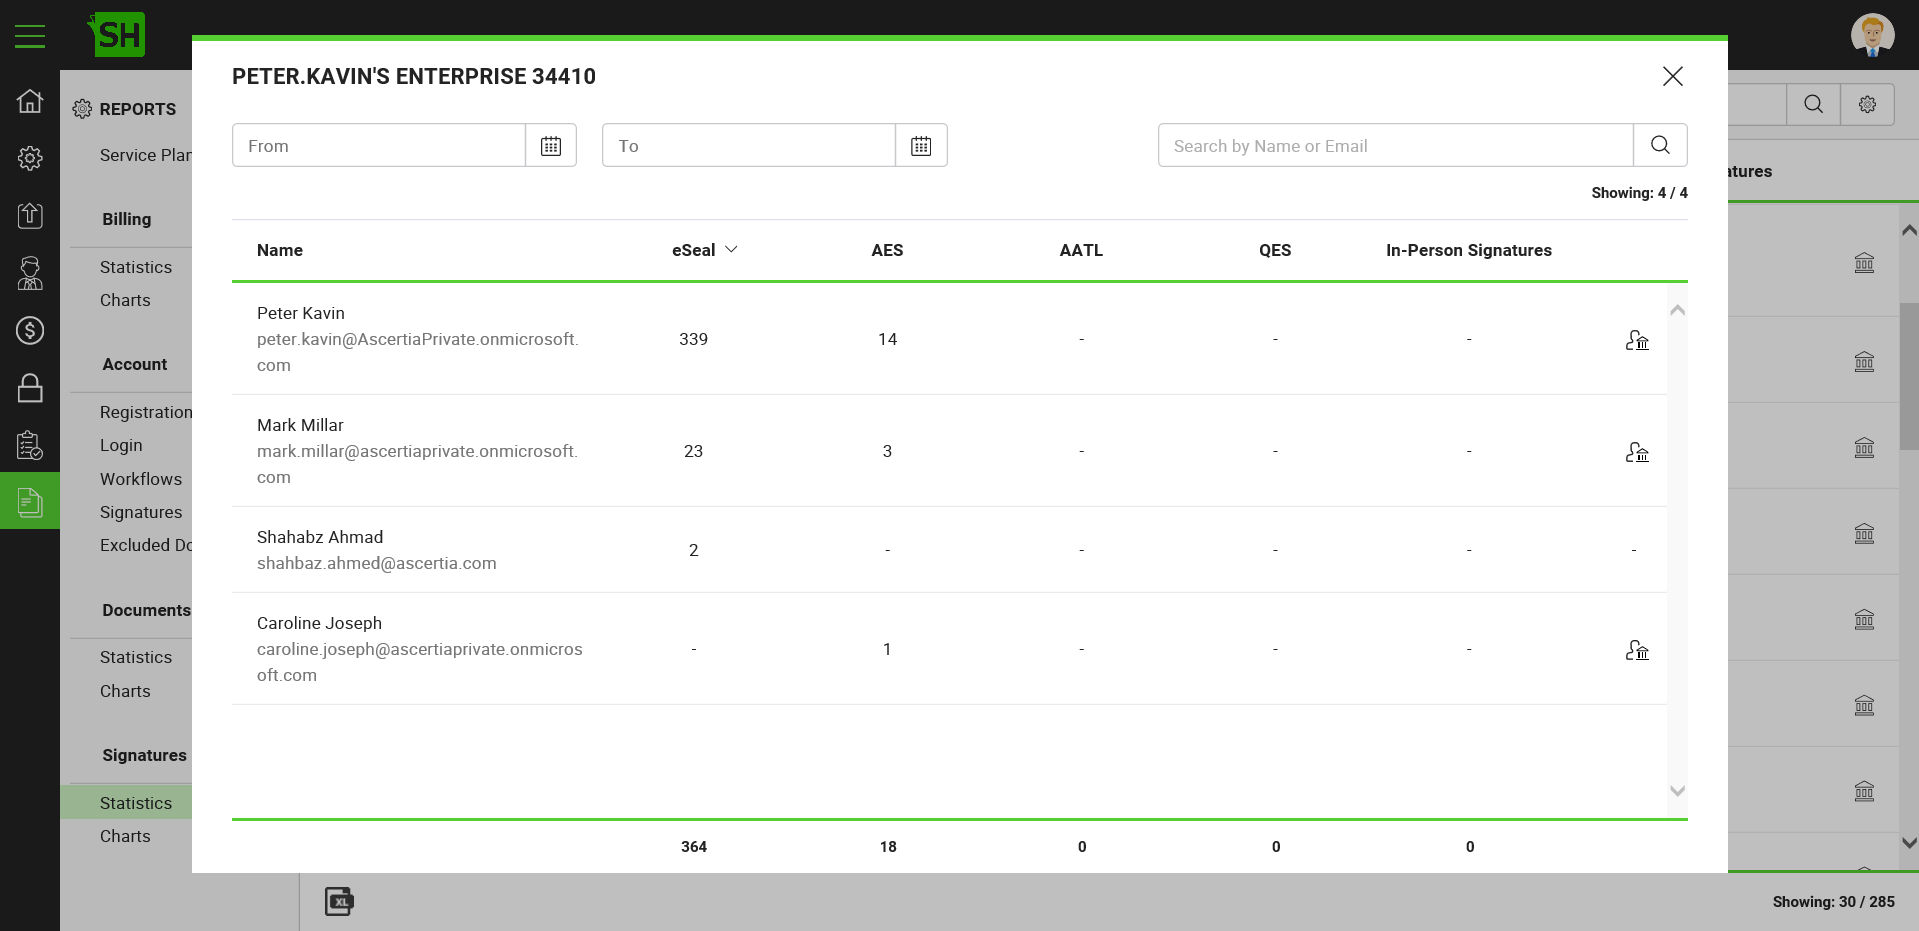
- Consumption by Signature Levels - This pie chart delineates the total number of electronic signatures, digital signatures and in-person signatures that have been consumed in your deployment.
- Top Ten Accounts by Signature Levels - This bar chart lets you select a signature level from the given list and specify the date parameters to see its top ten performers from your deployment. Click the
 menu from top right corner of the bar chart to specify your preferences, i.e. Top ten users who have:
 - Applied the highest number of digital signatures in a specified time period
- Applied the highest number of electronic signatures in a specified time period
- Applied the highest number of in-person signatures in a specified time period
- Timeline by Signature Levels - This timeline lets you choose a signature level from the given list, frequency, and the date parameters to view their respective graph. Click the
 menu from top right corner of the timeline to specify your preferences i.e.
 - Total number of electronic signatures applied on daily basis within a specified time period by all users
- Total number of digital signatures applied on weekly basis within a specified time period by all users
- Total number of in-person signatures applied on weekly basis within a specified time period by all users
- Total number of signatures applied on monthly basis within a specified time period by all users, and so on.
Download the report stats in excel sheet
Click  available at the bottom of the "Report" screen. The excel sheet file is downloaded to your local Downloads folder.
See also
- Welcome
- SigningHub Architecture & Deployment
- Getting Started
- Manage SigningHub Admin Configurations
- Manage Custom Service Plans
- Manage SigningHub Accounts
- Billing Information
- Manage SigningHub Admin Access
- View Operator Logs
- Security
- Third Party App Integration Keys
- SigningHub FAQs
- Configurator Notes
- Document Revisions