Usage Report
By selecting the Usage Report link from the top of the page, the following screen will be shown. By default it shows the below transaction details:
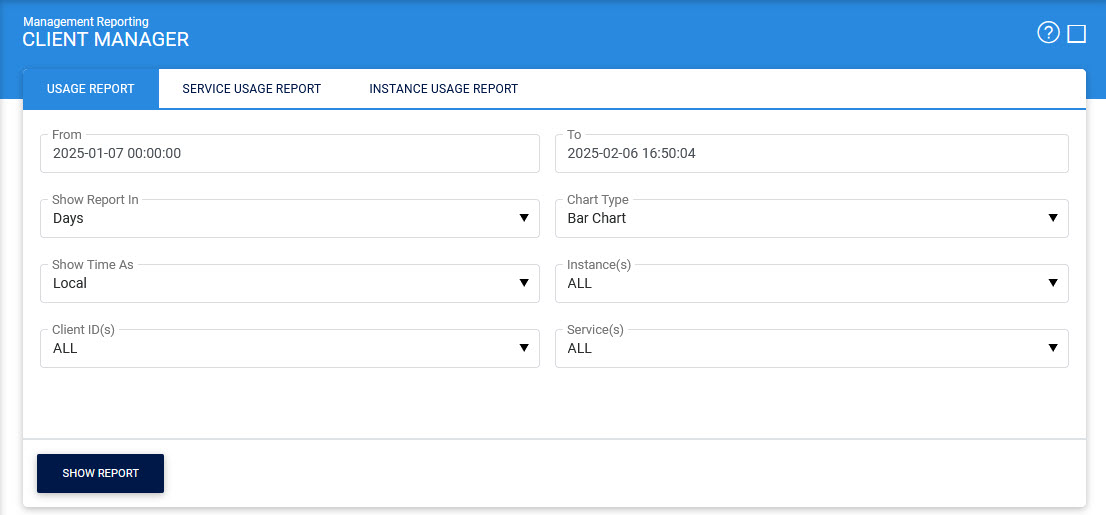
The configuration items are as follows:
|
Items |
Description |
||
|
From |
Select the start date for the date range you want to report on. |
||
|
To |
Select the end date for the date range you want to report on. |
||
|
Shows Report In |
It allows the user to filter the report according to defined 'Hours', 'Days', 'Months' or 'Years'. |
||
|
Chart Type |
It allows the user to select the report display type i.e. 'Bar Chart' or 'Line Graph'. |
||
|
Show Time As |
It allows the user to select time-zone to be displayed on the report i.e. 'Local' or 'UTC'.
|
||
|
Instance |
It allows the user to select one or more installed instance IDs to be displayed in the report. The user can choose a specific instance or include all available instances. |
||
|
Client ID |
It allows the user to choose a client ID from the list of registered clients. The user can select a specific client or include all client IDs in the report. |
||
|
Service |
It provides the option to select a service from the list of services permitted for the selected client. The list of services includes:
|

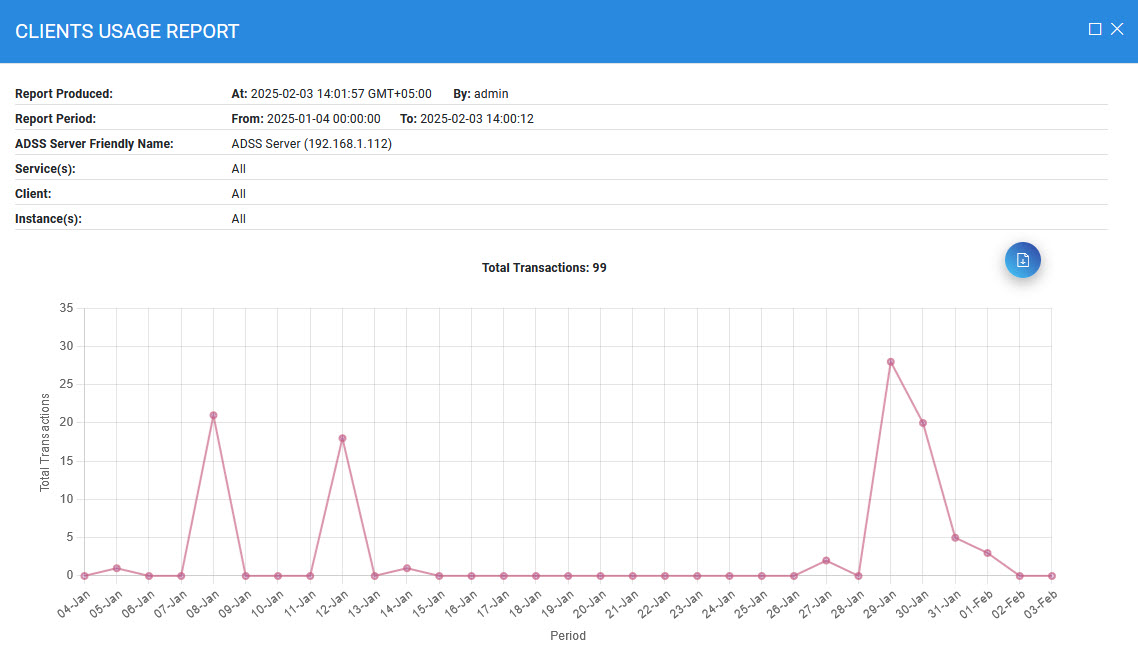
Line Graph
If Line Graph is selected in 'Chart Type' and the user clicks on Show Report button, then the following report type will be displayed:
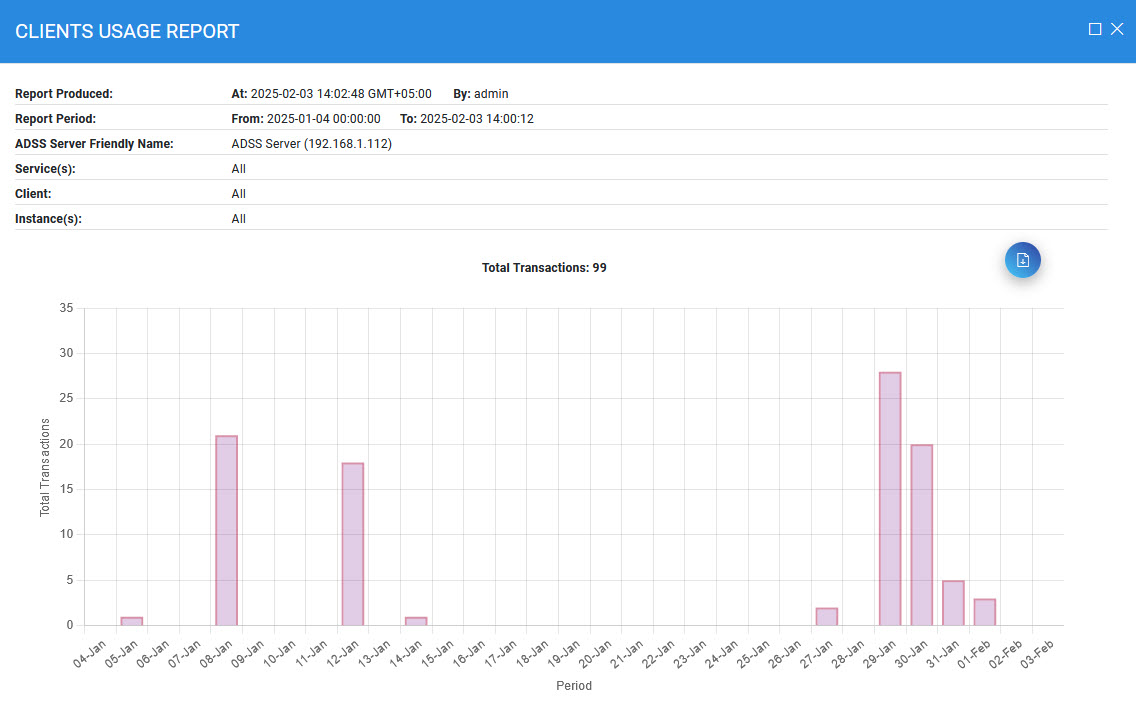
Bar Chart
If Bar Chart is selected in 'Chart Type' and the user clicks on Show Report button, then the following report type will be displayed:
See also