SigningHub enables you to view the graphical representation of signatures related stats of your enterprise. This includes pie charts, bar chart and timeline of signature activities. Use them to monitor the overall system usage from different aspects to control your billing.
View signature charts of your enterprise
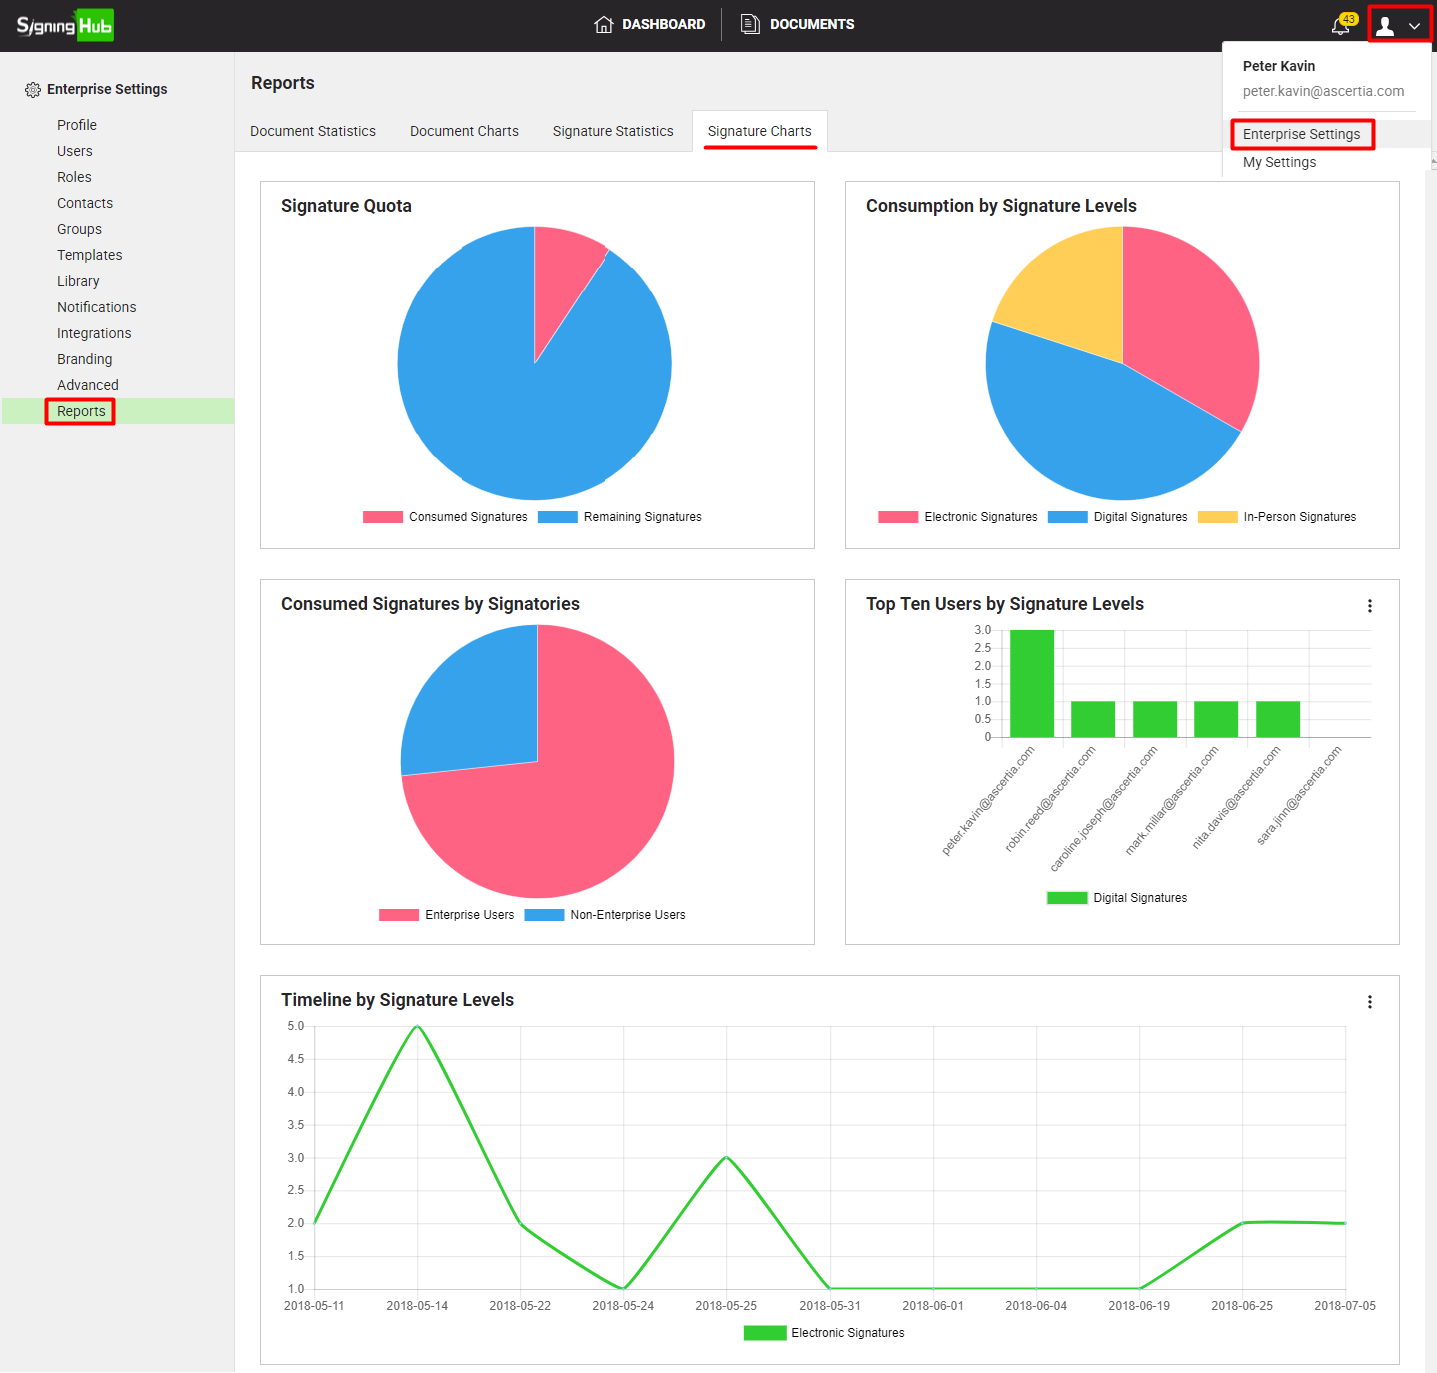
This pie chart delineates the number of consumed and remaining signatures out of the allotted signature quota of your enterprise account.
This pie chart delineates the number of electronic signatures, digital signatures and in-person signatures applied out of the consumed signatures quota of your enterprise account.
This pie chart delineates the number of your enterprise users and non enterprise users (i.e. Guest users and External users) who consumed the signature quota of your enterprise account.
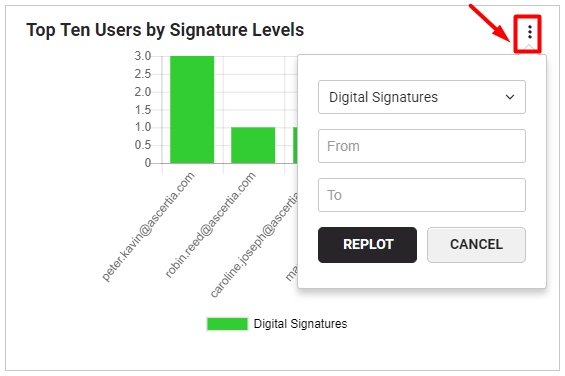
This bar chart lets you select a signature level from the given list and specify the date parameters to see its top ten performers from your enterprise users, i.e. Top ten users who have:
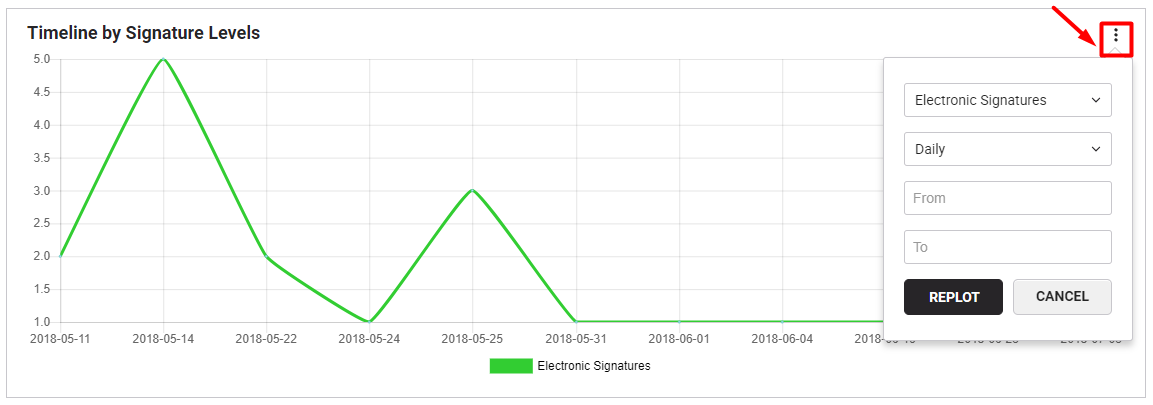
This timeline lets you choose a signature level from the given list, frequency, and the date parameters to view their respective graph, i.e.